Pi may be an irrational, transcendental, decimally never ending nor repeating constant. But it does play well with others, at least on the musical scale. Musician Michael Blake of Quebec Antique performs some Pi slices — out to 31 places:
When we say Information Architecture (IA) we are really talking about everything you can define about a solution without specifying the underlying system (the raw plumbing) or specifying the particular user interface that will be employed to deliver and manipulate the information. By thinking about the architecture of how information is used, how it flows, and how it fits within the user’s world (its context), you can capture the essence of how to build a system that is not only intuitive but futureproof.
—MAYA Design: What is Information Architecture?
A global tour of J-based data-viz, from IBM Many Eyes to Brazil’s Infografio 2.0, Journalism in the Age of Data: “A video report on data visualization as a storytelling medium.”
The annotated Flash chapters are best, but there’s also a 50min Vimeo video, a podcast series (.m4v), and an accessible set of YouTube vids. (Produced by Geoff McGhee during a Knight Journalism Fellowship.)
via FlowingData (“Basically, all the repeat offenders here on FlowingData are in this video talking about what they do best…”).
A friend, database/web designer Jon Nehring, is configuring some colored county-level data visualizations (aka, choropleth map) for a client. During dev, a “happenstance created this image in SQL Server”:
The House Gates Built is not normally known as a fountain of innovation. But MS’sLiveLabs has really delivered the future in the form of Pivot. It’a web application — “don’t call it a browser”: getting lasix
“Gary Flake: is Pivot a turning point for web exploration?” ativan online
We’re navigating the web for the first time as if it’s actually a web, not page to page, but at a higher level of abstraction… So right now, in this world, we think about data as being this curse. We talk about the curse of information overload. We talk about drowning in data. What if we can actually turn that upside down and turn the web upside down, so that instead of one thing to the next, we get used to the habit of being able to go from many things to many things, and then being able to see the patterns that were otherwise hidden? If we can do that, then, instead of being trapped in data, we might actually extract information. And, instead of dealing just with information, we can tease out knowledge. And if we get the knowledge, then maybe even there’s wisdom to be found.
—Gary Flake, Technical Fellow, Microsoft; founder/director, Live Labs
Also check the TED talk for LiveLabsPhotosynth — another Seadragon derivative.
Matt Dunne, Google’s head of community affairs, names numbers:
Each day, Google processes 2 billion searches, sends two e-mails per second through its Gmail account system, and uploads 22 hours of video onto You Tube, per minute. It would take a lifetime to watch the video posted on the site every three months.
One question we asked on this poll gives a good idea of how difficult it is to inform the public on this complicated issue. Medicare is obviously an inherently public program, but just for the heck of it we asked the somewhat tongue in cheek question of whether the government should ‘stay out of Medicare.’ 39% of Americans said yes.
—”National Poll: Obama Approval, Health Care, Birthers” ( 172K)
Other sad states of American affairs in thenational phone survey (909 voters, Aug 14-17 2009, MOE +/-3.3%.909): “Do you think Barack Obama was born in the United States?” 44% of Republicans said no. (For all respondents: Yes- 62%, No- 25%, Not Sure- 14%.)
Here’s a question I hope PPP poese in their next survey: “Should aborted evolutionists serve birther Obamacare death panels?” Let folk figure that one out.
The Encyclopedia of Life: “Imagine an electronic page for each species of organism on Earth…” —Edward O. Wilson. EOL is community-building online database of animals, plants, and other organisms. Lost to learn, for instance,I know that we saw on our hike yesterday 150 Cervus elaphus.
All these services hint at the revolutionary potential of the new computing grid and the information utilities that run on it. In the years ahead, more and more of the information-processing tasks that we rely on, at home and at work, will be handled by big data centers located out on the Internet. The nature and economics of computing will change as dramatically as the nature and economics of mechanical power changed with the rise of electric utilities in the early years of the last century. The consequences for society – for the way we live, work, learn, communicate, entertain ourselves, and even think – promise to be equally profound. If the electric dynamo was the machine that fashioned twentieth century society – that made us who we are – the information dynamo is the machine that will fashion the new society of the twenty-first century.
At work and at home, people found they could use the Web to once again bypass established centers of control, whether corporate bureaucracies, government agencies, retailing empires, or media conglomerates. Seemingly uncontrolled and uncontrollable, the Web was routinely portrayed as a new frontier, a Rousseauian wilderness in which we, as autonomous agents, were free to redefine society on our own terms. “Governments of the Industrial World,†proclaimed John Perry Barlow in his 1996 manifesto “A Declaration of the Independence of Cyberspace,” “you are not welcome among us. You have no sovereignty where we gather.†But, as with the arrival of the PC, it didn’t take long for governments and corporations to begin reasserting and even extending their dominion.
The error that Barlow and many others have made is to assume that the Net’s decentralized structure is necessarily resistant to social and political control. They’ve turned a technical characteristic into a metaphor for personal freedom. But, as Galloway explains, the connection of previously untethered computers into a network governed by strict protocols has actually created “a new apparatus of control.†Indeed, he writes, “the founding principle of the Net is control, not freedom – control has existed from the beginning.†As the disparate pages of the World Wide Web turn into the unified and programmable database of the World Wide Computer, moreover, a powerful new kind of control becomes possible. Programming, after all, is nothing if not a method of control. Even though the Internet still has no center, technically speaking, control can now be wielded, through software code, from anywhere. What’s different, in comparison to the physical world, is that acts of control become harder to detect and those wielding control more difficult to discern.
—Nicholas Carr, The Big Switch
Edward Tufte’s praise and crit of iPhone rez, w/ phrases like: “computer administrative debris”, “chartoon”, “content/information is interface”, “in a land of cluncky cellphone interfaces”. Had to transcribe this GUI gem:
“To clarify, add detail. Clutter and overload are not an attribute of information, they are failures of design. If the information is in chaos, don’t start throwing out information; instead, fix the design.”
“Wavefields” are data graphics that draw on and completely fill the entire display surface, using every pixel on the data plane to show high-resolution, complex, multiple, animated statistical data-flows. Wavefields extend my work on sparklines.…
As the metaphor for sparklines is the resolution of typography, the metaphor for wavefields is the HD video, which records approximately 1 gigabyte per minute, a data throughput that might finally make our statistical graphics worthy of the powers of the human eye-brain system.
—
[Note that E.T. leaves out “ear” from the “human eye-brain system” — his audio reflects his sonic neglect.]
On our new Didya Know page, we’re breaking down the stats & sources from the popular fact-filled “Did You Know” videos, along w/ updates and errata — lotsa the latter. In fact we’ve found so many errors, the page has become less “Did You Know?” and more “how do we figure out what we know?”
Here’s a YouTube playlist with two versions of “Did you Know?” and two parodies:
Another video on the info-age from Prof Wesch and the students of Digital Ethnography (@ KS State U). How do they do it? Their shots are always so simple and sparse, their writing terse, but sequentially, in a series of small insights, they build into something beautiful and moving. “A Vision of Students Today:”
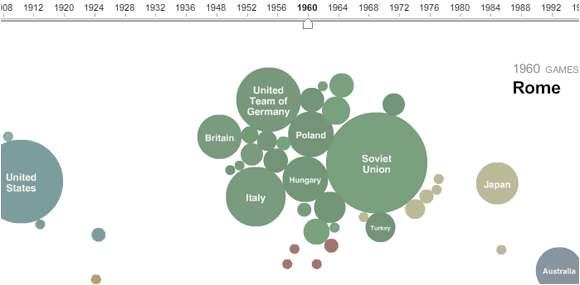
An interactive (flash) Olympic Medal Count Map/chart/list, from the 1896 Olympic Games in Athens to 2008 in Beijing, on NYTimes.com. Screenshot:
Circles are sized by the number of medals that countries won in summer Olympic Games. Use the slider to view past Olympics, or click on a country to display a list of its medal winners.
 A global tour of J-based data-viz, from IBM Many Eyes to Brazil’s Infografio 2.0,

 The
The